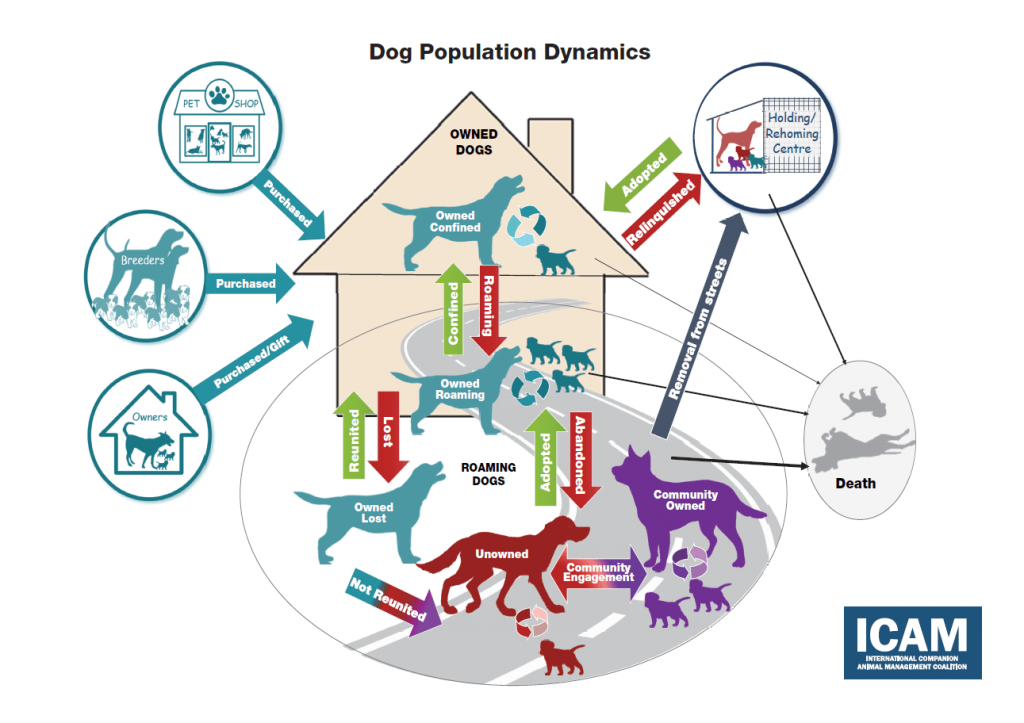
Chapter 1 of ICAM’s (2019) Humane Dog Population Management Guidance introduces a graphic (Figure 1) illustrating the most commonly seen sub-populations and processes in dog population dynamics; sub-populations are represented by coloured dog icons and processes by the back, green and red arrows.
This is the full size pdf of that dog population dynamics graphic.
Select the language of the file you would like to download below:
YOUR FEEDBACK
Feedback from people like you is invaluable to us.
Help us improve by letting us know how our tools work in practice or by sending us any
suggested documents.


